
Story at a glance:
- Data-informed design can help maximize the benefits of in-person work.
- Smart building technology can help workers feel more informed about and in control of their environment.
- Buffer zones allow for focus time in quiet spaces while also making chance interactions possible.
After months (or is it years now?) of working from home, we’ve had plenty of time to customize the home office—making micro-adjustments to suit our moods and comfort, optimizing for online meetings, and accounting for both expected and unexpected disruptions. Now with the pandemic decreasing in severity, and the possibility that we may be expected to be physically present in the workplace or at least consider it as an option, returning to a shared, somewhat distant workplace may bring with it a mixed bag of feelings—notably a lack of control over the physical environment.
For some, returning to the office is a relief. No more package deliveries, dogs barking in the background of your meeting, family members ducking through the back of your video chat. For others, it means sacrificing the ability to throw open a window for fresh air, have an exercise break, or easily create a quiet space for focus time. But it doesn’t have to be a full tradeoff. There are ways to make collaborative workplaces savvy and smart.
How do the elements of your home office impact your creativity and productivity? What about your mood? Your physical health? How do these things help you fulfill your role and your company’s mission, vision, values?
Some aspects of working somewhere other than your home might be more beneficial than you might suspect. A commute, for instance, can provide proven psychological benefits—the opportunity to mentally and physically switch between the “home” you and “work” you. Additionally, “Zoom fatigue” is real. Breaks from screen time while collaborating with colleagues in the physical workspace can be incredibly productive. The social interactions afforded by an office setting create opportunities to learn from those around you, brainstorm spontaneously, and reinforce a shared mission or purpose.
But just how do we measure these benefits? And how do we leverage this data into human-centered design decisions? These, of course, are the questions we ask ourselves as designers. What are the key metrics needed to continually improve upon the workplace experience? How do we not only design spaces that respond to the learnings already available, but also spaces that allow for continued evolution, adaptation, and information capture? With the right tools, metrics, and processes, we can develop better, user-centered design solutions.
Making the Workplace Smart
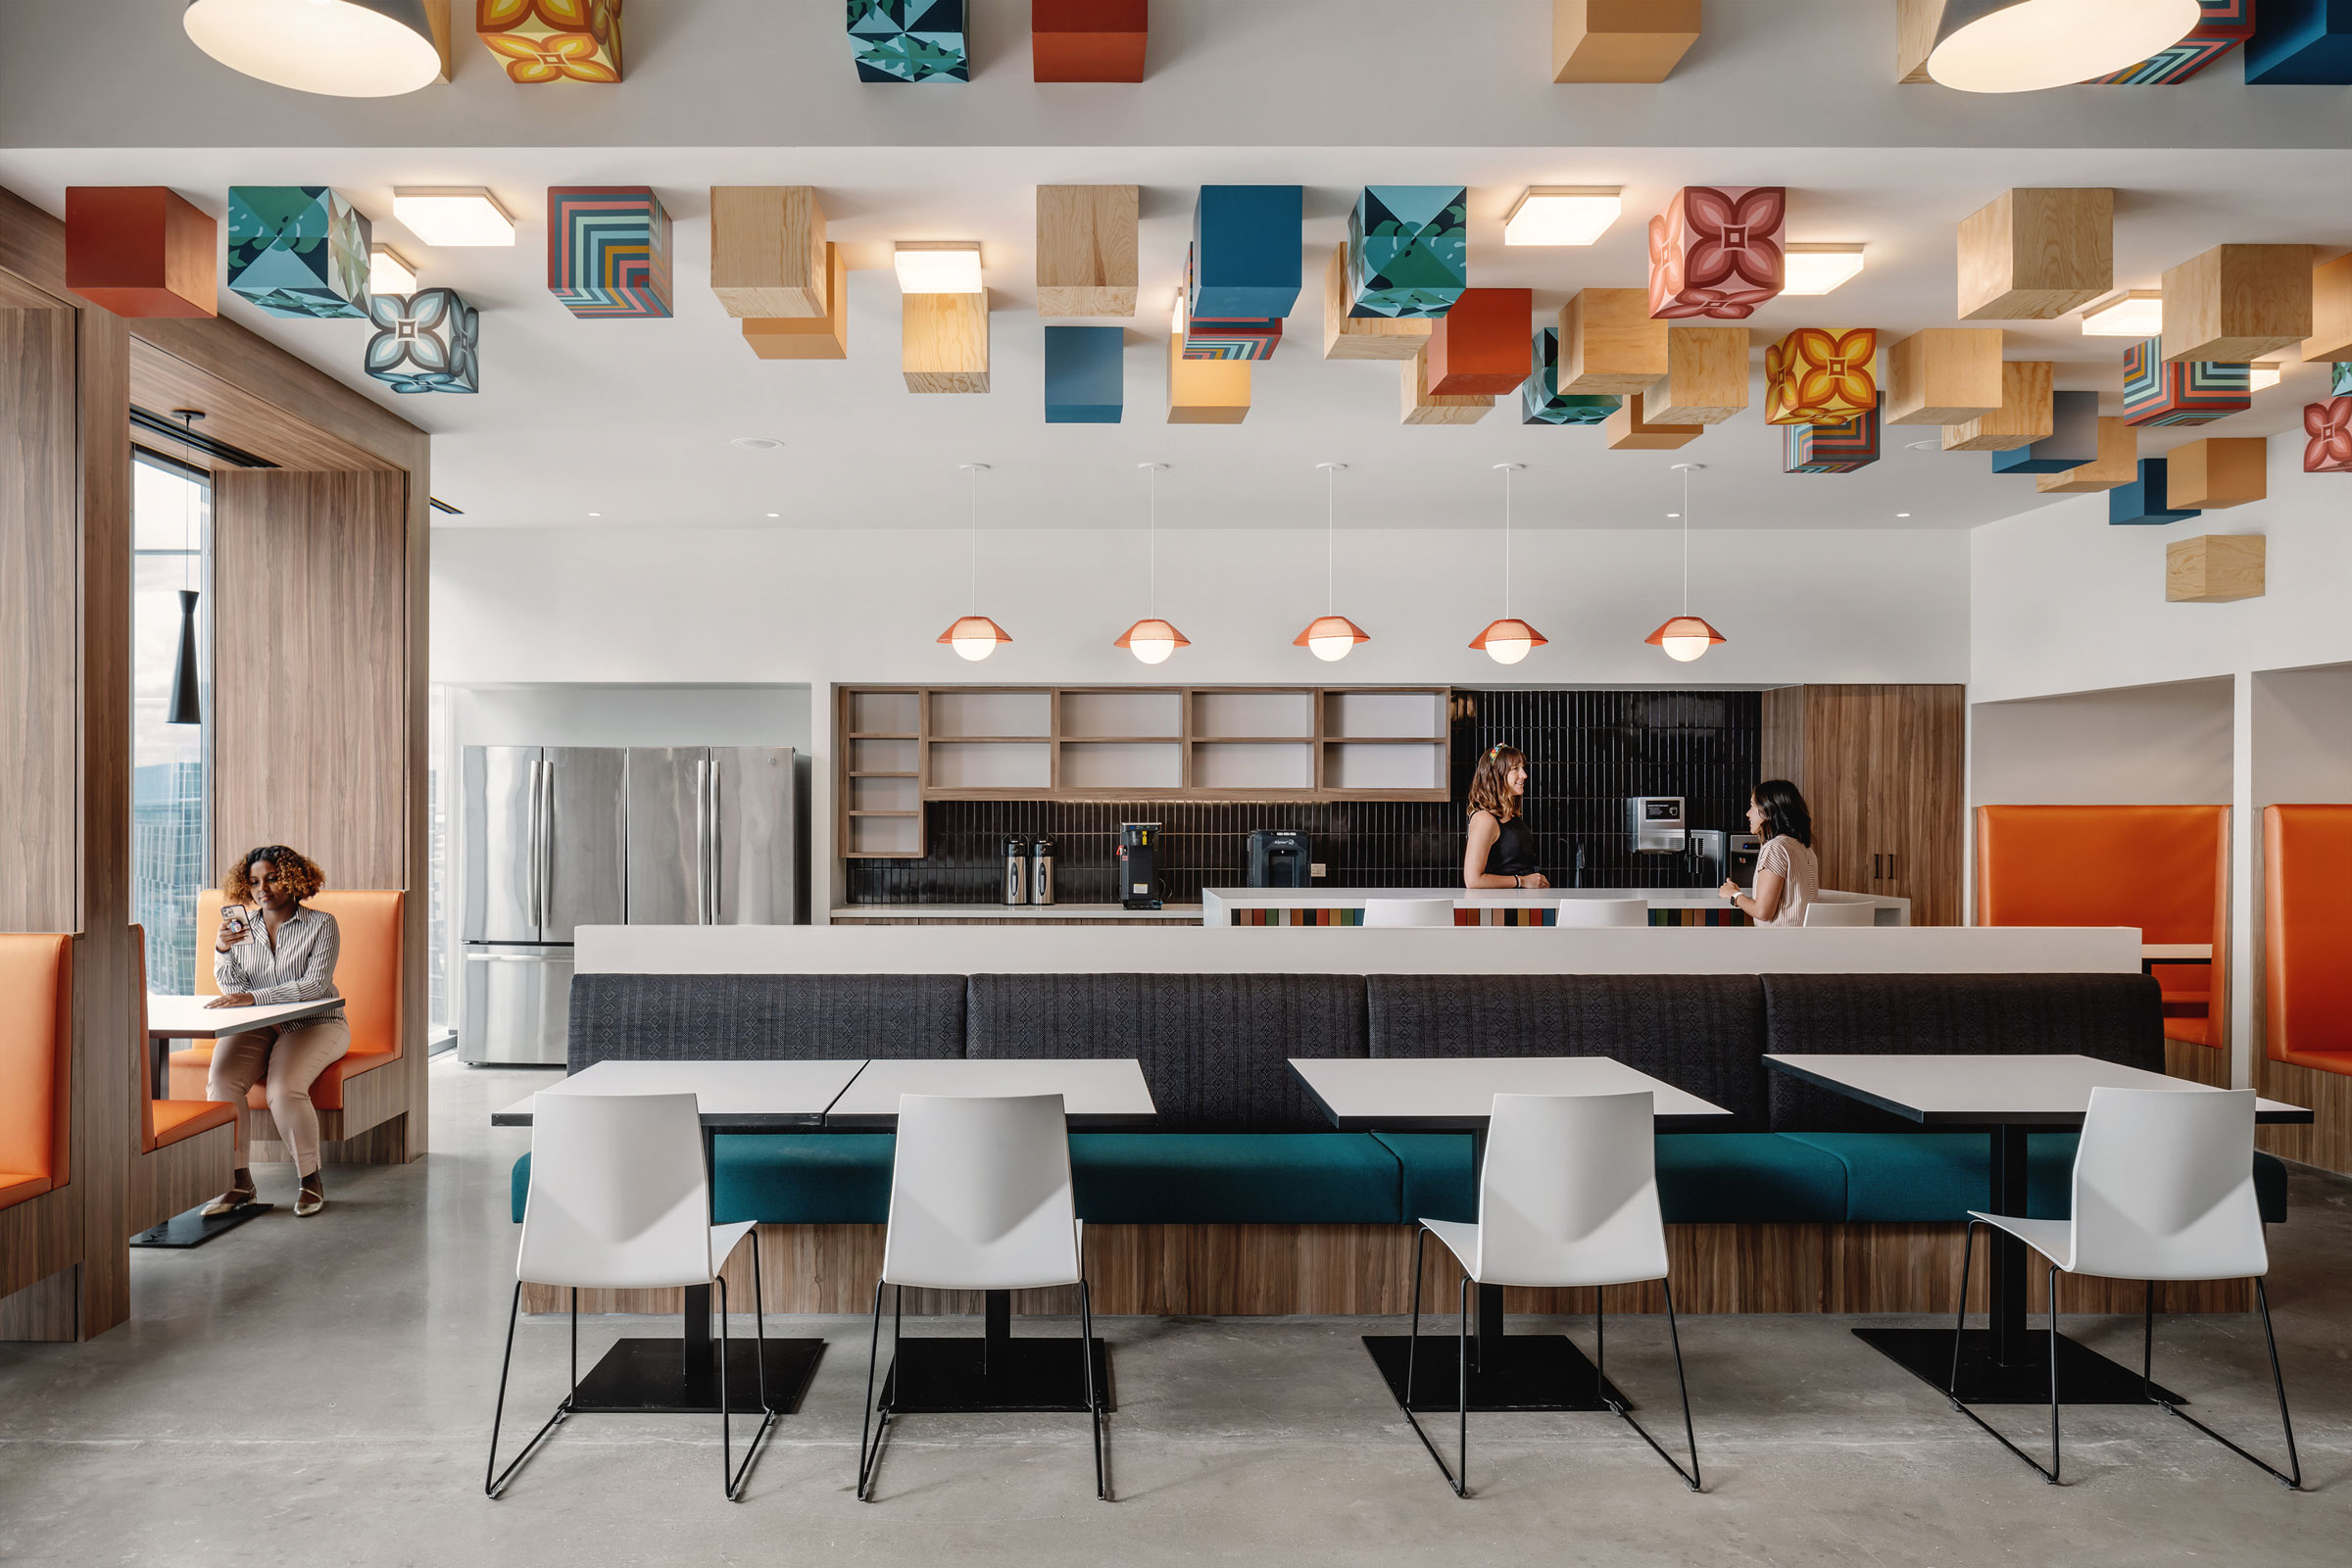
The social interactions afforded by an office setting create opportunities to learn from those around you, spontaneously brainstorm, and reinforce a shared mission or purpose. Photo by Chase Daniels
With employee well-being top of mind, smart building technology has increased in prevalence and sophistication in recent years. Prior to the pandemic, designing for smart building technology was largely preparatory and consisted of providing the infrastructure that would enable various technologies down the road. Throughout the pandemic and currently, building owners and clients have been more inclined to utilize smart building features, making immediate use of the preparatory infrastructure or fully integrating the technology with new construction or renovations.
These technologies, which often include a digital interface to relay critical metrics like indoor air quality, not only help convey a sense of safety but also aid in sharing about a building’s positive environmental impact with real-time analyses.
Other smart building features might include responsive roller shades as part of an overall daylight harvesting system, automatic water faucets and toilets, and touchless doors—all incorporated into a master control system that can report real-time results for building management.
With the increased focus on safety and well-being, smart building systems have a multi-fold benefit of letting owners and occupants know exactly what measures are in place and how they are impacting the environment. They also give building management teams specific data related to the resources they utilize. Users have more visibility into health and safety metrics and are therefore able to return to the office feeling more informed about and in control of their surroundings
Using Ecotones and Vibe Mapping
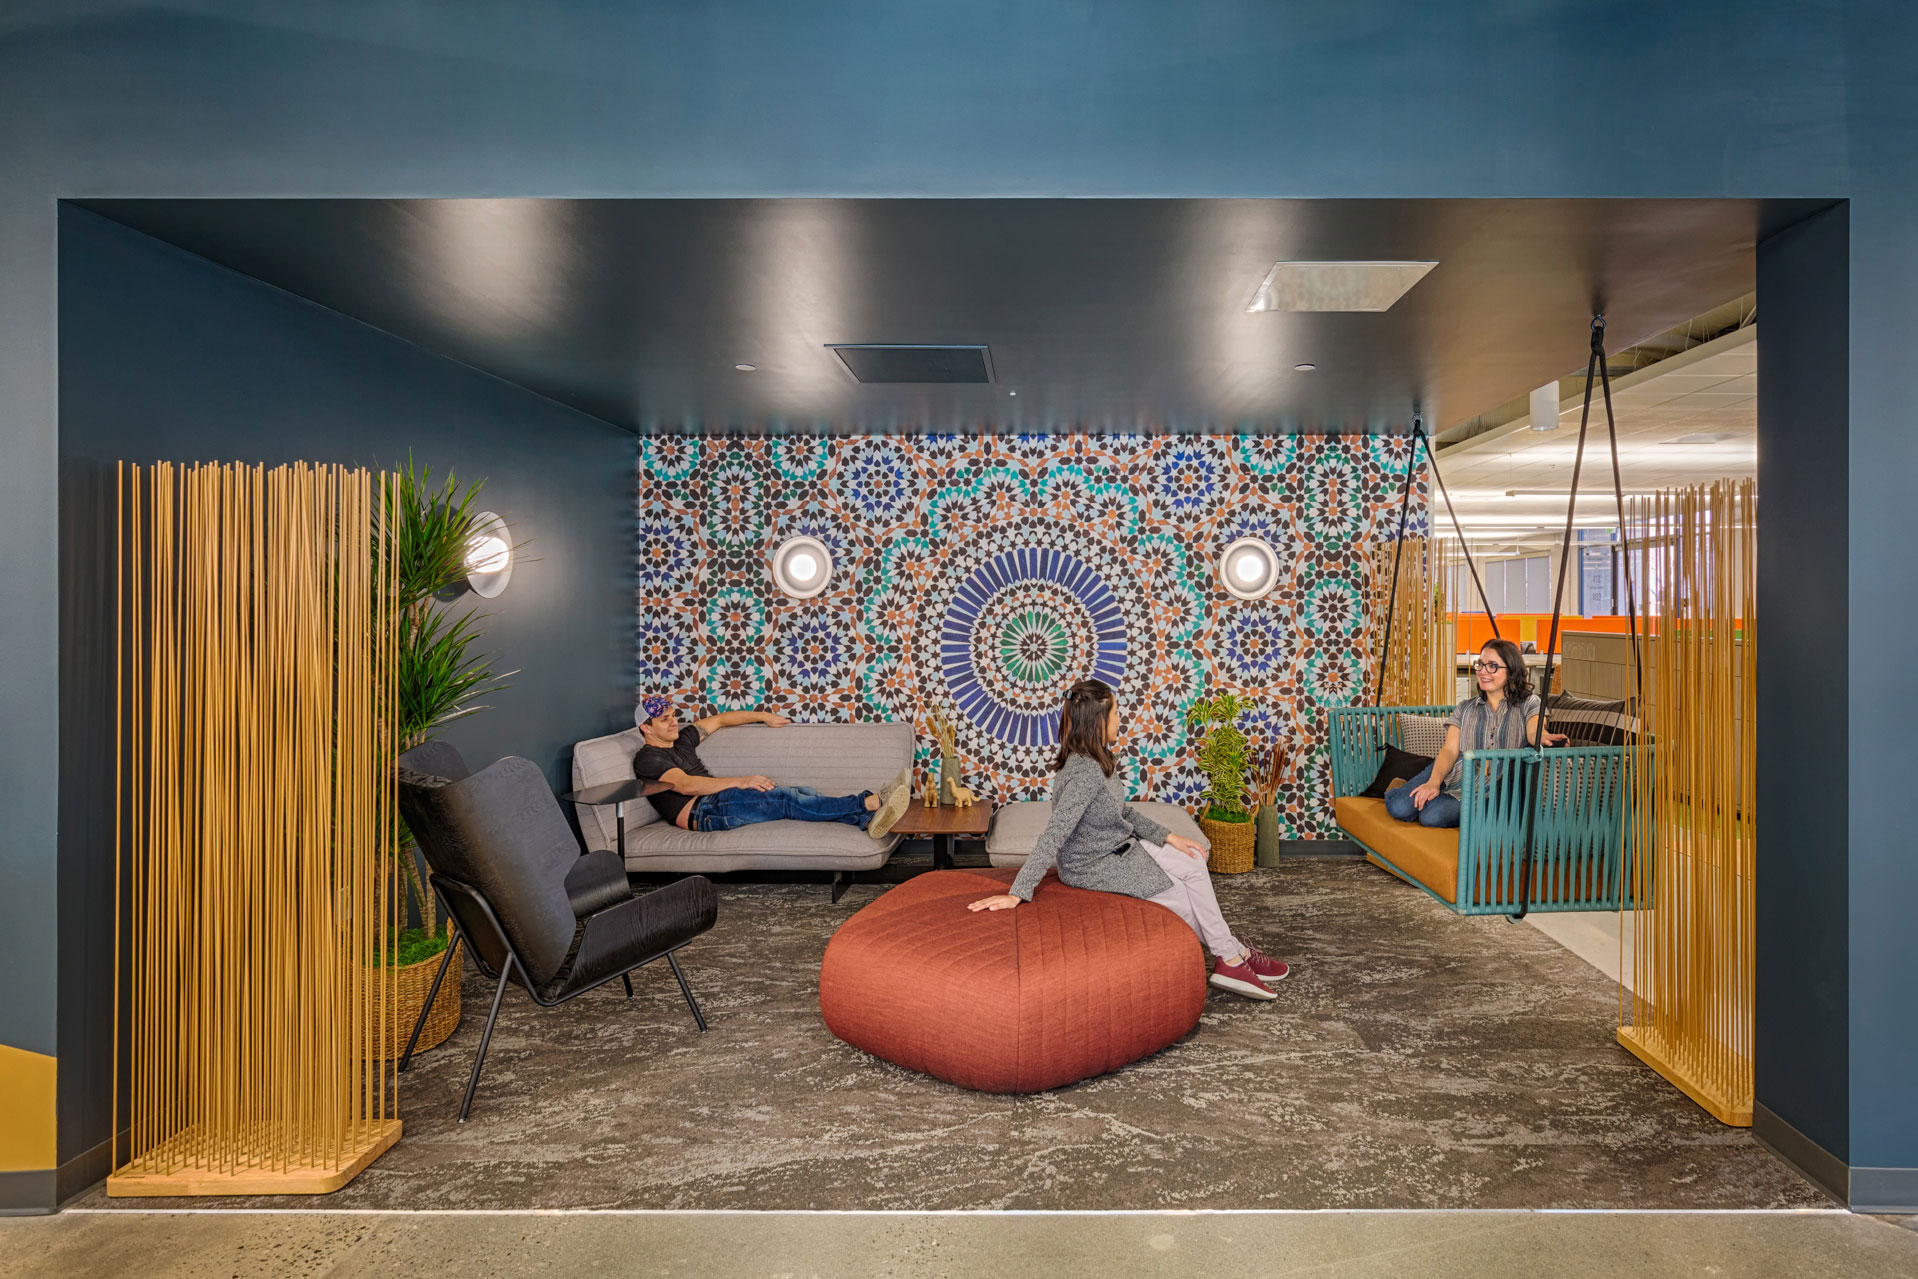
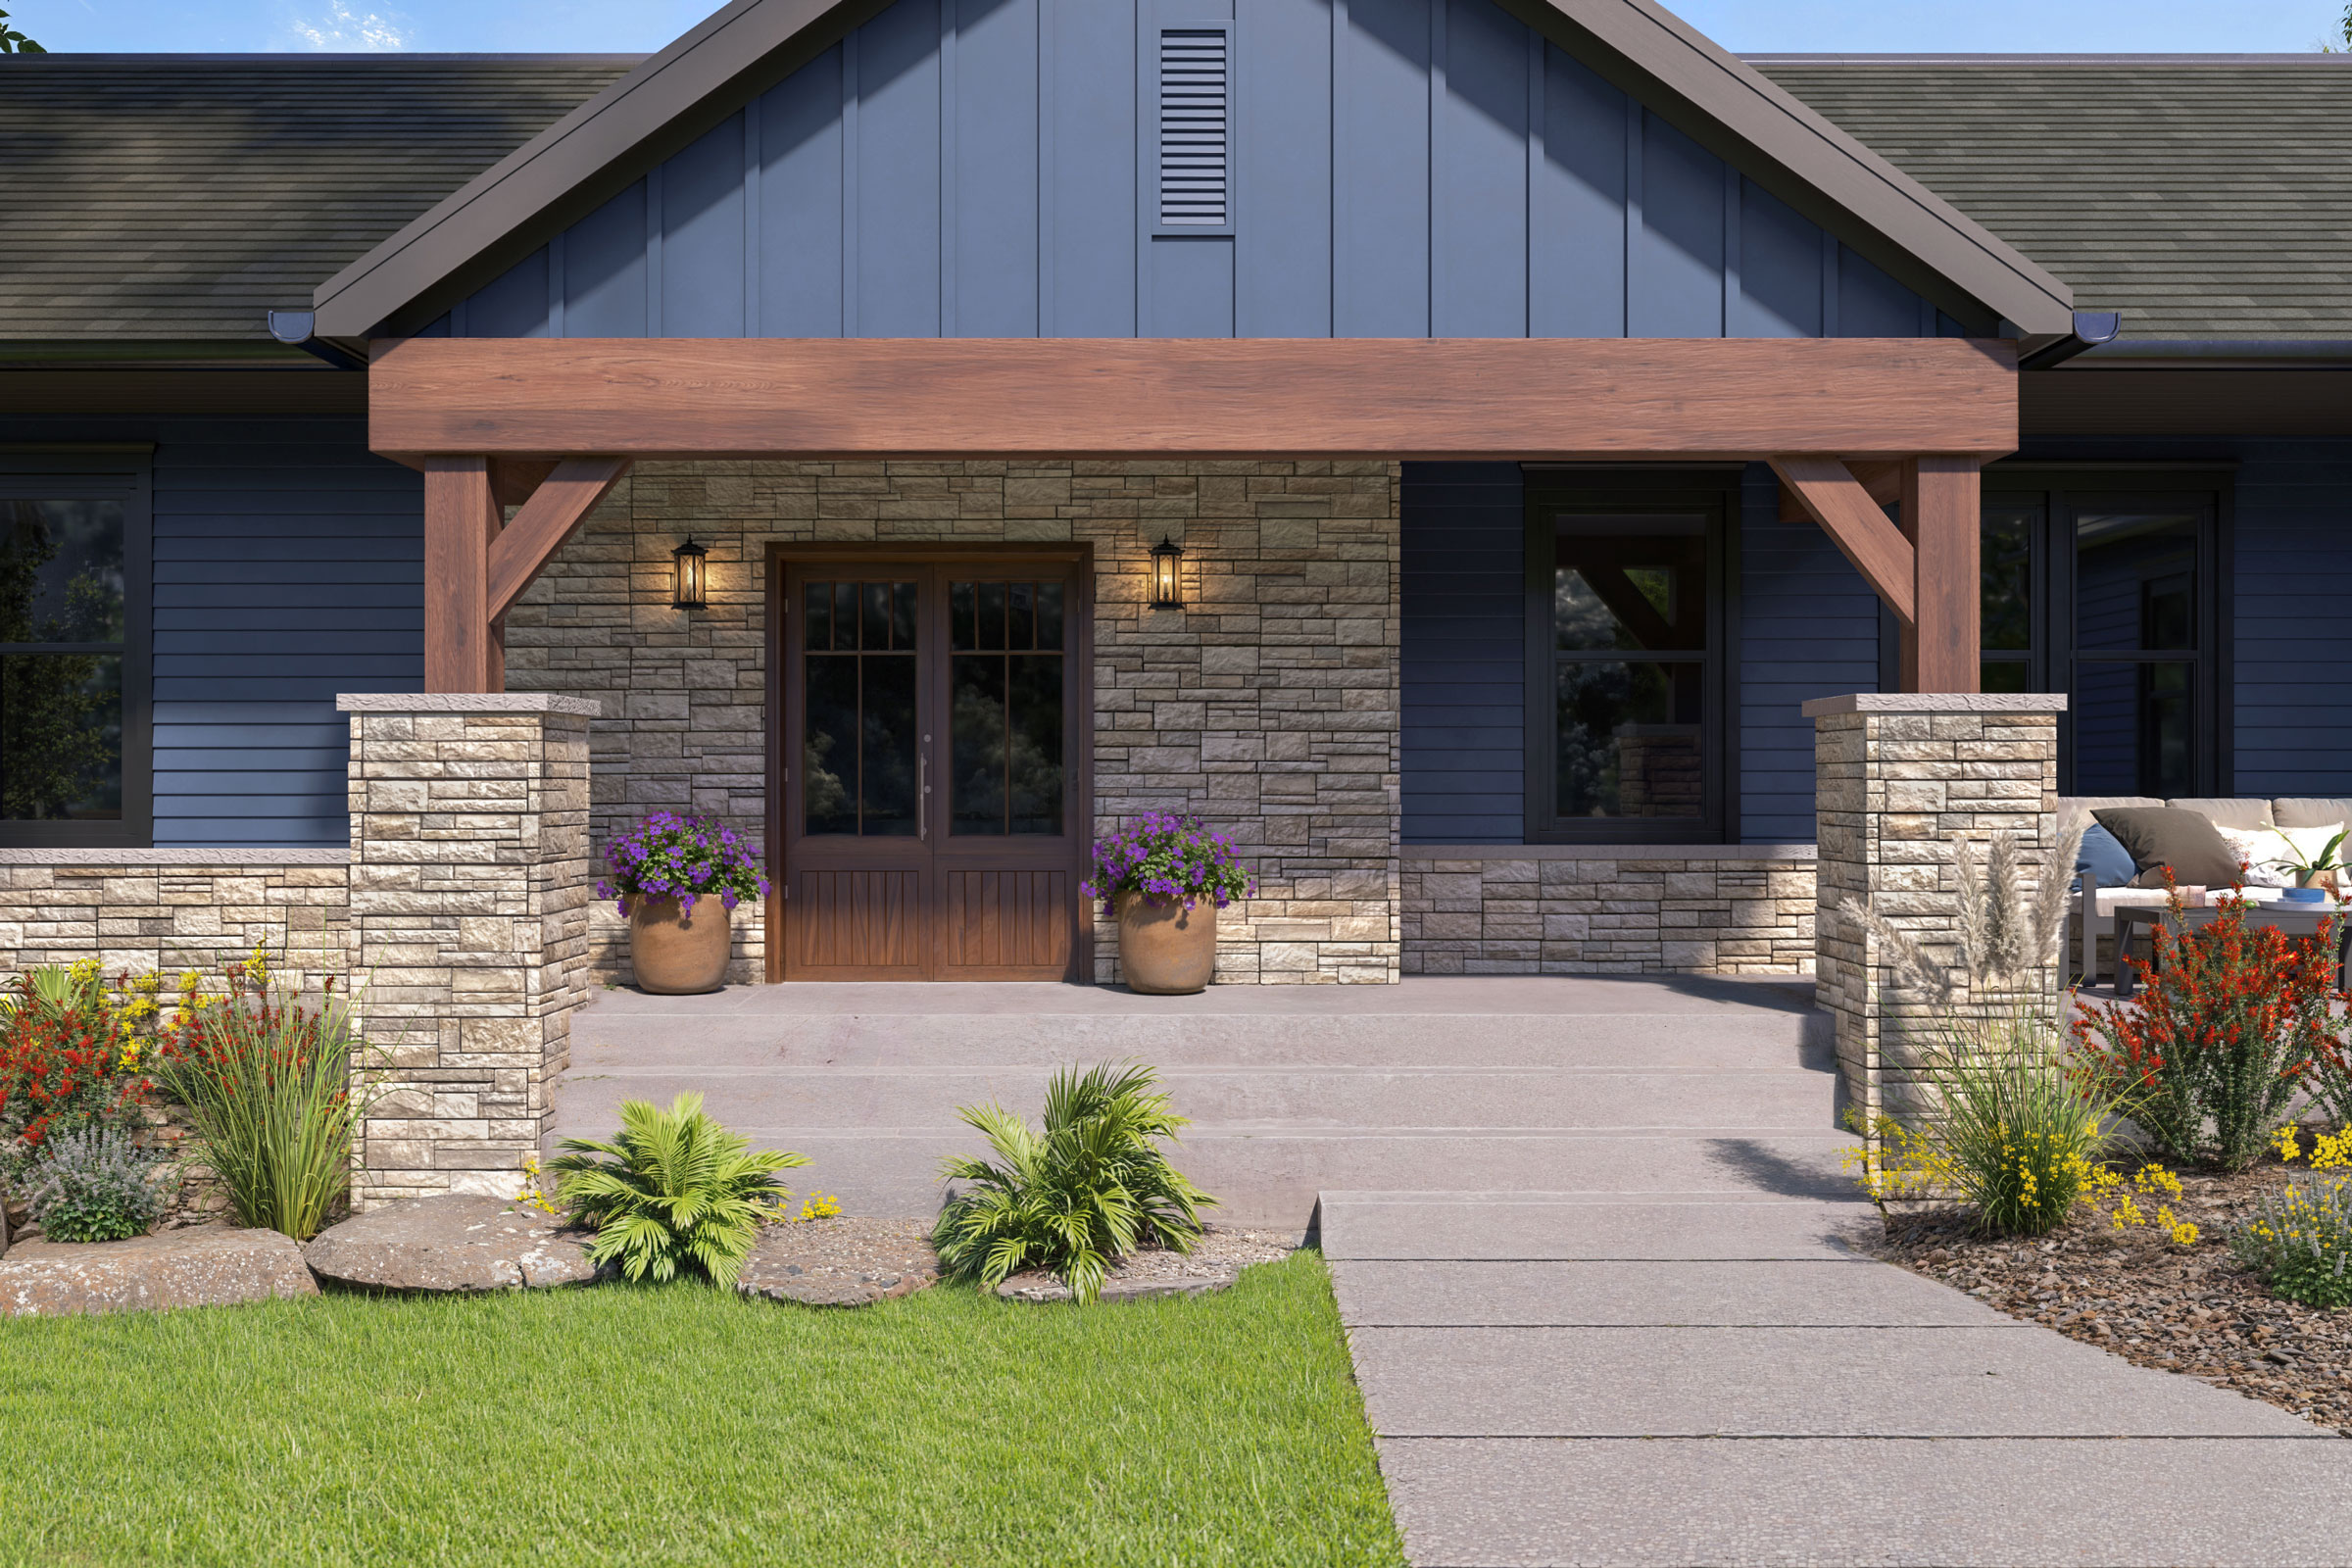
Intentionally leveraging “ecotones” makes it possible to create buffers to achieve quiet spaces for focus time while also making chance interactions possible at key moments. Photo by Marco Zecchin
Ecotone is the scientific term for the transitional area between two biological communities. These areas are often rich, diverse zones. As a design community we can learn from this biodiversity to shape the environments where we live and work. With a continually shifting workforce dynamic, plus a pandemic changing how we think about shared workspaces, it’s a critical time to consider what makes workplace environments effective, appealing, and accommodating for all types of knowledge workers.
With ecological design thinking applied to circulation we can leverage community zones where activities blend. This blending of functions and spaces is unique to collaborative environments, i.e. shared workspaces. By intentionally leveraging these ecotones it’s possible to create buffers to achieve quiet spaces for focus time while also making chance interactions possible.
To be successful we must first identify the needs of an ecotone to appropriately design for it, thus ensuring activation of in-between zones, where the desired, diverse activities overlap. One of the tools we use to identify those needs is called vibe mapping, which leverages data to identify these in-between zones. A vibe map is a kind of heat map that documents activity within a space. When worked into the design process, a vibe map can inform where intentional transitions can be utilized to positively impact workers’ perceptions and mentalities, and other ways to maintain happy, healthy, productive teams.
Designing for the User Experience
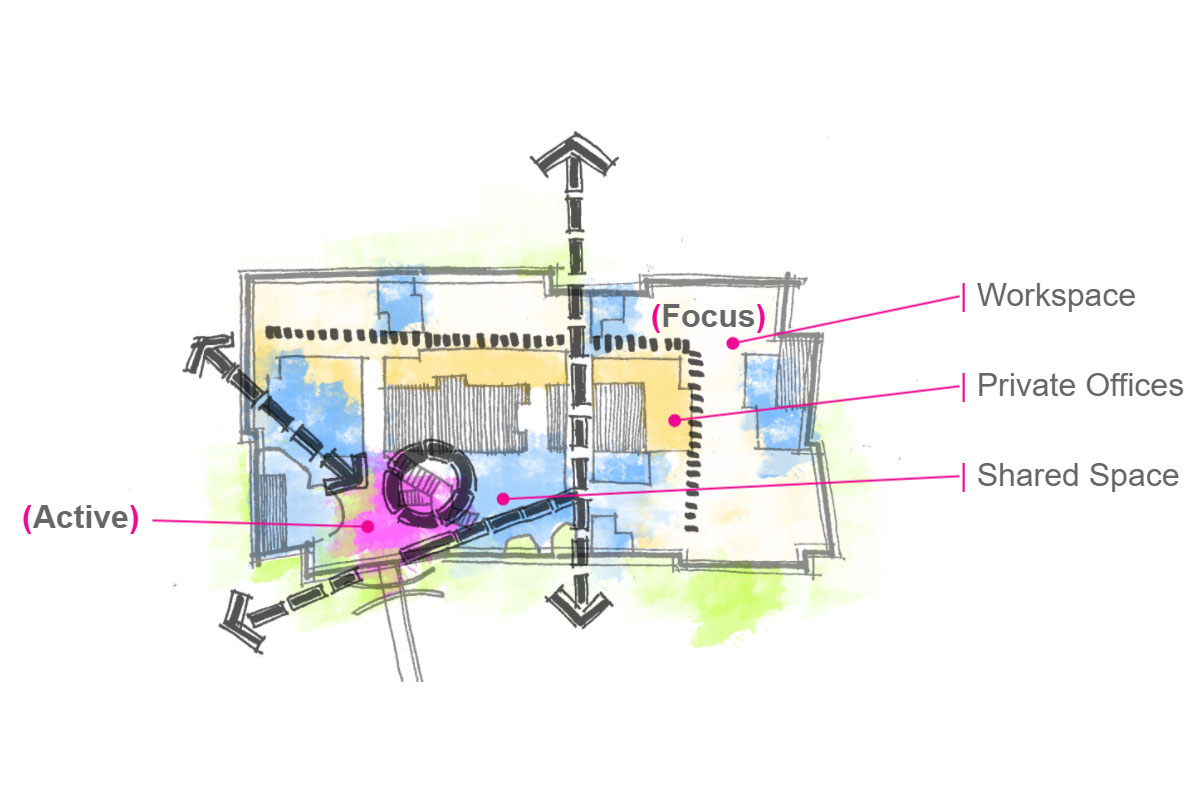
A vibe map is a kind of heat map that documents activity within a space. It can be used to identify and activate in-between spaces in the workplace. Drawing courtesy of Cushing Terrell
Once equipped with data provided by post occupancy research (a detailed look at how a facility is meeting the original design objectives and operational requirements), smart building technologies, vibe maps, and other tools, it’s worth making the distinction between data-informed and data-driven design.
Data-driven design is reactive—responding to metrics captured over a period of time and analyzed for key insights. Data-informed design, on the other hand, is research-based. It centers on first-hand observation and even considers elements that are immeasurable, like a company’s core mission or their goals for culture. Identifying the client’s core mission and vision orients our data-informed decisions to ensure our solutions are optimal and align with goals related to core values and culture.
Data-informed design leverages the application of human-centered design or “design thinking” methodologies to provide a framework and rigor for the process in sum. Taking this approach ensures the data gathered is paired with first-hand observation and an acute focus on solving for the specific needs of the teams and individuals who will use a particular space.
By executing a design process that includes data and metrics, in unison with design judgements based on observed outcomes, we can develop better, smarter, more human-centered workplace design solutions.
Jennifer Moore contributed to this article.