

Story at a glance:
- Top contractors use KPIs to measure, monitor, and manage performance.
- The most important project KPIs are driven by client demands.
- The right technology can help you effectively monitor these eight indicators.
Data is one of a construction business’ most valuable assets. However, because construction firms generate so much data across multiple projects and job sites, it can often feel like information overload. So where is a construction business to begin? Let’s take a look at some of the most important data points and how you can utilize the right technology to simplify the way you monitor your business.
Key Performance Indicators
Construction projects come with a lot of risk and slim margins, so it’s especially critical to track the status of your projects and overall business health. Best-in-class contractors use a series of key performance indicators (KPIs) to measure, monitor, and manage performance.
KPIs are high-level benchmarks set at the project or enterprise-level based on specific predefined measures. Decision-makers can use KPIs as yardsticks to evaluate how things are going, spot red flags, and act decisively.
What’s Important to Monitor

Photo courtesy of Sage
For contractors, the most important project KPIs are driven by client demands. At any given time, you should be able to answer the following questions:
• Is the project on schedule?
• Is the project on budget?
• Is the work free from defects?
• Is the work getting done right the first time?
• Is the work being performed safely?
It’s important to also have a good handle on your business health and be able to quickly answer questions like:
• Is enough cash coming in?
• Is there enough work?
• Is labor productive?
• What is the profit margin?
When deciding what to monitor, it’s important not to rely solely on backward-looking indicators that measure the events of the last quarter or month. You need real-time insights so that if an issue arises, you can act before it’s too late.
Eight Indicators Every Contractor Should Monitor
1. Liquidity
It is important to always know how much cash you have available. You should be able to drill down to the project level to determine which projects are providing liquidity and which are consuming it.
2. Work Backlog
Keeping tabs on backlogged work—and the expected gross margins on that work—will help you avoid risk associated with insufficient work. Having this information can also help you estimate future cash flow and adjust your business plans accordingly.
3. Labor Productivity
Labor productivity can have a big impact on your profits, so it’s important to always know where teams are tracking on three essential components: budgeted hours, hours worked, and percent complete.
4. Schedule Variance
The simplest way to track schedule variance is by taking the original planned completion and subtracting the current forecasted completion, which will give you the number of days ahead or behind schedule. You can then divide the schedule variance by the total remaining duration in days to look at the variance as a percentage. This helps evaluate the significance of the schedule variance—2% variance is a lot easier to make up than a 20% variance.
5. Budget Variance
Monitoring costs in real-time will help you quickly identify any budget issues. While some variance to budget is to be expected, setting an acceptable KPI for such variance will allow you to catch anything that falls outside of that threshold.
6. Change Requests
Changes can lead to profit loss if you don’t proactively track, document, and negotiate payment for all unplanned work and expenses. Staying on top of your change requests can help ensure you get paid for all changes on the job, without disputes or misunderstandings.
7. Project Cash Flow
This KPI helps track whether individual projects are generating or consuming cash. You can drill down to identify and better understand execution successes and failures on projects.
8. Committed Cost Indicator
Given current supply chain issues, rising material costs, and labor shortages, it is especially critical for your suppliers and subcontractors to be contractually committed to your projects. Otherwise, it opens your business up to unnecessary risk. This can be even more detrimental on longer-duration projects.
As you think about these indicators you should monitor, you might wonder how you could possibly keep track of all these moving parts. That’s where technology comes in.
The Role of Technology
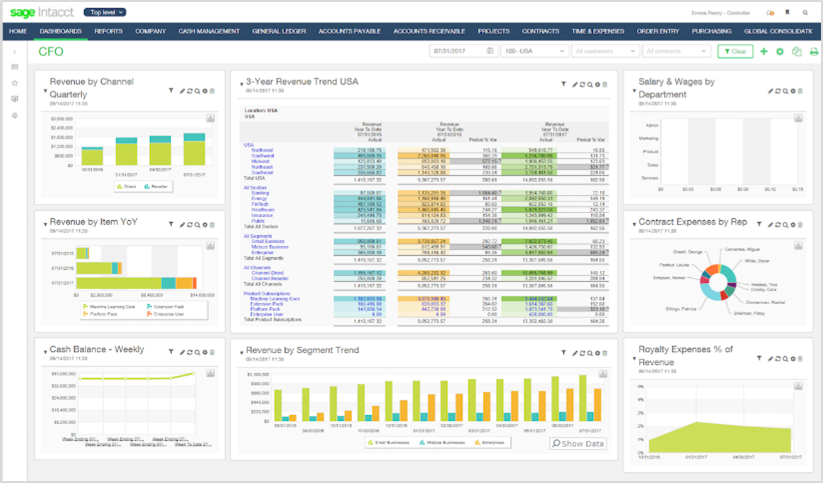
Snapshot of an effective dashboard. Image courtesy of Sage
Technology plays a vital role in streamlining business processes, including maximizing data and tracking KPIs. Three pieces of technology your business must have in place for effective monitoring are integrated software, an automated alert system, and an effective dashboard.
Integrated Software
Construction businesses can experience inefficiency and a lack of transparency when it comes to data management. Have you ever found yourself searching for certain information or wondering if the data you have is accurate? This hinders your ability to monitor KPIs that enable strategic decision-making.
Utilizing integrated software helps you easily get consistent data, which in turn allows for timely measurement against KPIs and more rapid and accurate completion of key business processes. Data is centrally managed in a single database and structured consistently so you can trust that it is accurate. Deploying integrated, construction-specific software helps create an environment that fosters information-based decision making.
The benefits don’t stop there. Integrated software also:
• Supports and automates critical industry-specific functions (such as job costing, estimating, equipment, and project management).
• Provides information transparency and supports tracking of timely measurements against KPIs.
• Eliminates silos of information and reduces data reentry that can result in errors.
Automated Alert System
KPIs and other business metrics have traditionally been captured and conveyed in a combination of reports, spreadsheets, or charts. While these methods can be helpful, an alert or warning system that’s tied to your integrated software solutions can provide more immediate and actionable information.
An alert system works by actively monitoring the data housed in your software. When one of the tracked events occurs—for example, an invoice becomes overdue—the system triggers an email, desktop message, or text message notifying the appropriate personnel of the issue so they can take immediate action.
This is critical considering the vast amount of data you would have to filter through. In most cases it would be difficult to find what you’re looking for, and even if you did find it, there’s a good chance that by the time you did it would have lost its timeliness. An alert system helps ensure the right information is getting to the right people at the right time. For example, an alert system can notify you when:
• A subcontractor has an insurance certificate that expires in 30 days
• A job has dropped below a profit threshold.
• An accounts receivable invoice is 60 days past due.
• A deadline is approaching for a component of a project.
• A project manager has overdue RFIs, submittals, and change requests.
Effective Dashboard
Integrated software and an automated alert system provide even more benefits when paired with an effective dashboard. A dashboard is a business tool that displays all of your vital information, including metrics and KPIs, in one place. It provides a quick, easily digestible visual snapshot of your data. A good dashboard should be simple, fast, and meaningful so you can quickly see the items that are most important for you to monitor.
Dashboards can provide an effective solution to the overwhelming amount of data that you experience every day. Dashboards can also improve employee productivity— and save your company money—by providing easier, more intuitive access to project and accounting details. They allow you to quickly view and analyze the information you need to aid in your decision making. And because the data is generated in real time you can be confident that the information is accurate, something you can’t say with certainty about a report someone printed you last week.
An effective dashboard:
• Presents information clearly, quickly, and compellingly.
• Helps you measure and monitor all your KPIs in one place.
• Offers personalization options so users can configure data views based on their role.
• Minimizes unnecessary distractions, which could cause confusion.
• Enables users to drill down to find more detail and context.
• Provides a design and structure that is visually pleasing.
The increased business visibility that comes from closely monitoring your construction business is vital in today’s environment, so don’t be discouraged by the overwhelming amounts of data your business generates. The right technology will help you find, filter, and focus on the information that matters most so you can focus on running your business.